
We’ve Added a New Page to the Kabuto Dashboard – Activity
Repairing computers effectively is certainly an important aspect of your job as a technician, but as a business owner, it’s equally critical to understand the overall status of all your repairs and how they influence the way you make business decisions. With Kabuto, you can quickly understand an individual client’s system health but there hasn’t been any functionality to aggregate this client data to make higher level decisions. Until now!
We just added another layer to Kabuto called the Activity page, which gives you a variety of metrics that you can use to better ascertain what is going on with your clients, and how frequently certain issues arise. Like other aspects of Kabuto, it’s in a nascent stage, so we’ll be continually refining it based on your feedback.
What’s Included on The Activity Page Currently:
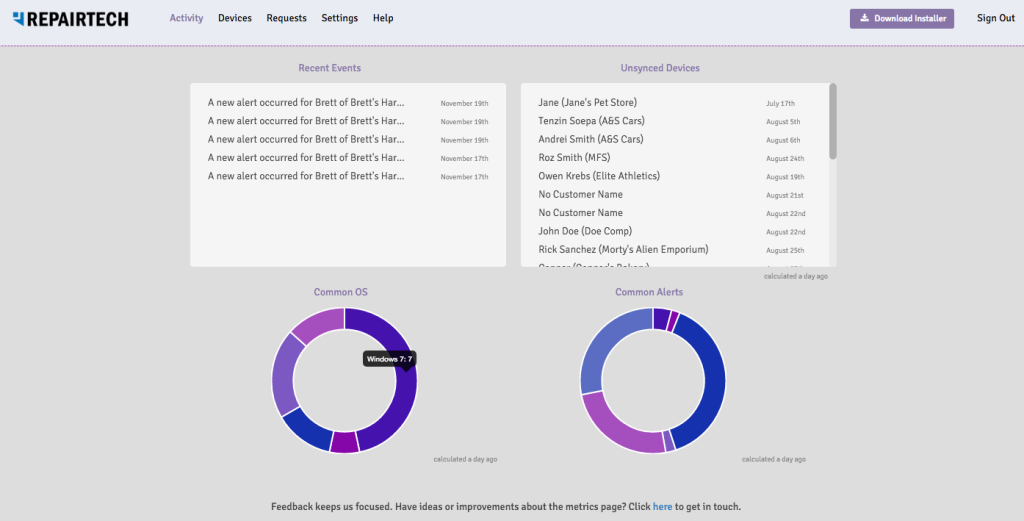
Recent Events
This is a feed of all the recent alerts, requests, and other events that have taken place within your account. Click ‘View’ for any event you need more details about, and you’ll be taken to that particular device on the dashboard.
Unsynced Devices
This is a feed of all the devices in your account that haven’t been recently synced. Stay in the loop about devices you might need to follow up on.
Common OS
A handy chart showing how many of your clients are on a particular operating system.
Common Alerts
An even handier chart showing you a breakdown of your most common alerts.
That’s about it for now. By the way, this is the work of the crazily talented, relentlessly focused, mechanical keyboard typing clojure-mystic: Stephen ‘In a Different County’ Baldwin.
As always, feedback is our lifeblood. If you have any ideas, comments, questions, concerns, or general harangues about how we can improve, please get in touch via this link: https://repairtech.zendesk.com/hc/en-us/requests/new
If you haven’t checked out Kabuto yet, you gotta. Learn more here: http://kabuto.io/
Cheers mates,
Max